 The Weather at
Guyra NSW
A compilation of present and past weather at Guyra
NSW Australia
Guyra is located on the Northern
Tablelands of New South Wales, elevation 1332 metres
This website has been prepared with information
supplied by Jeff Martin,
Observer for Bureau of Meteorology at Guyra
Image: Snow was thick on the ground on
2nd August 2025
during the heaviest snowfalls for 41 years.
© Image by Jeff Martin
The town of Guyra is at the
top of the range on the Northern Tablelands of New South Wales with the Great
Divide running right through the town itself. The Bureau of Meteorology weather
station is located in the grounds of the Guyra Hospital at an elevation of 1332 metres.
This station has been in operation since August 1981.
Prior to this the post office operated a weather station from 1911 to 1972 with
a number of gaps. Rainfall has been recorded for a
longer period starting in 1886 at the post office.
Readings were taken twice daily at the hospital at 9am and 3pm until 1st August
2015 when it was reduced to 9am only.
RAINFALL CHART for your farm/home rainfall
recordings. PDF format - printable.
Current Weather Conditions
Present
temperature, humidity, wind and rainfall in Guyra here.
Note: This is a privately owned weather station in North Guyra.
Data recorded here varies slightly from the official station at the Guyra Hospital.
Conditions are updated every few minutes through the Weather Underground
website. If temperatures are displayed in Farenheit,
go to the settings icon in the top right corner of the screen and set to
degrees C.
Recent Weather
Last three 9am observations from the Bureau weather
station at the Guyra Hospital here.
Monthly Data Files
Daily data for this month and the previous 12 months here.
Climate Averages
Climate averages and extremes for Guyra Post Office here.
This set of statistics uses rainfall data from 1886, but temperature
data is limited to the period 1911 to 1956 with a few missing years, and 1965
to 1972.
Climate averages and extremes for Guyra Hospital
here.
This set of statistics uses rainfall and temperature data from 1981 which means
the rainfall averages are not reliable for such a relatively short period. It
is recommended that rainfall averages from the post office site be used for
greater accuracy.
About Guyra’s
Weather
Guyra is the highest town on the Northern Tablelands
and as such records the lowest day time temperatures in the region. Overnight
temperatures however, particularly in the winter months, are frequently higher
than nearby Armidale and Glen Innes. This is because Guyra
is at the top of an exposed plateau where the wind may blow all night, whereas
Armidale and Glen Innes are in protected valleys where cold air drainage and
temperature inversions are common events allowing overnight temperatures to
drop to lower levels.
If you want to see snow on the Northern Tablelands, Guyra
is the place to be with an average of four to five snowfalls per year. Most
years Guyra manages at least one good snowfall with
snow several centimetres deep on the ground, easily
enough to build a good sized snow person! During such
events the New England Highway is often closed to the north and south of
the town for a few hours or maybe a full day.
In general Guyra's has mild to warm wet summers, and
cold dry winters.
Rainfall
extremes:
Highest yearly total: 1,408.4 mm in 1890
Lowest yearly total: 302.0 mm in 2019
Temperature extremes:
Highest maximum: 37.8C on 15th January 1939
Lowest maximum: -0.3C on 3rd July 1984
during heavy snowfalls
Lowest minimum: -7.8C on 26th June 1971
 Guyra Weather News 2026
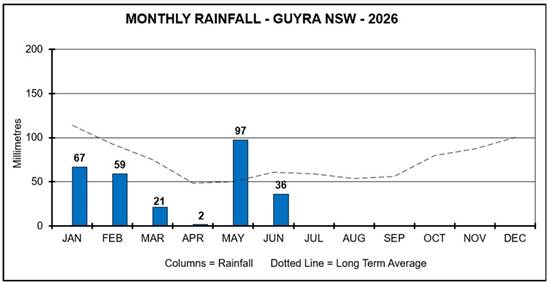
JUNE SUMMARY (Long term average in brackets)
Rainfall: 35.8 mm (61 mm) on 9 days
Average maximum temp: 13.1C (11.1C) - highest since June 2001
Average minimum temp: 2.9C (1.7C)
Highest maximum: 17.2C on the 17th
Lowest maximum: 6.5C on the 5th
Lowest minimum: -2.7C on the 24th
Days maximums lower than 10.0C: 1 (8.5)
Frosts: 11 (15)
Sunny days: 8 (13)
Days with thunder: 1 (1)
Days with snow: 0 (1)
Complete June
2026 data table (PDF
printable)
COLDEST MAY MORNING FOR 7 YEARS - 8th May - The overnight minimum of -4.1C was the lowest
May temperature since 31st May 2019 when -6.0C was recorded. The cold
conditions were caused by cold dry air following a cold front and trough which
passed through the region on the 7th.
WARMEST MAY DAY ON RECORD - 4th May - The maximum temperature of
21.7C just beat the previous record of 21.6C on 24th May 2016. The unusually
warm conditions were caused by north-westerly winds drawing warm air into New
South Wales ahead of a cold front which passed through the region early on the
5th. (Daily temperature data base commencing in 1965).
DRIEST APRIL FOR 46 YEARS - With a
total of just 2.0 mm for the month, it was the driest April since 1980 which
recorded 1.6 mm.
WARMEST APRIL WEATHER FOR 40 YEARS - 7th-11th April - Unusually warm conditions prevailed over the five days as
the result of very warm north-westerly winds from the centre
of the continent being directed into New South Wales ahead of a dry cold front
which passed through late on the 11th. Maximum temperatures: 7th: 25.3C, 8th:
26.6C*, 9th: 27.3C*, 10th: 26.8C*, 11th: 25.9C*.
(*Temps measured with a non-official instrument due to regular maximum
thermometer being out of order).
The maximum of 27.3C on the 9th sets a new record for
the month of April. The previous highest was 27.0C on 4th April 1986. However this is an unofficial new record because of non Bureau of Meteorology
instrument used.
COLDEST MARCH
DAY FOR 56 YEARS - 27th March - The maximum temperature of
just 12.2C was the lowest maximum for the month of March since 30th March 1970
when 9.4C was recorded. The unusually low temperatures were caused by cold strong
westerly winds following a severe cold front which passed through in the early
hours of the morning depositing 4.6 mm of rain.
 Guyra Weather News 2025
2025 MONTHLY STATISTICS TABLE here.
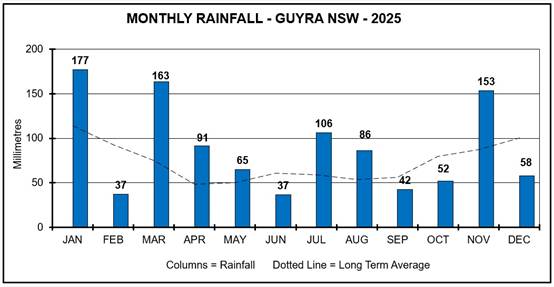
2025 RAINFALL: 1,067.8 mm, 190 mm higher than the average.
WARMEST OCTOBER ON RECORD - Based on maximum
temperatures October 2025 was the warmest on record from 94 years of available
data commencing in 1911 (with a few gaps). The average maximum for the month
was 23.1C, the previous highest was 22.6C in 1917. The unusually warm
conditions were caused by numerous low pressure
troughs directing very warm air into New South Wales from the centre of Australia.
The maximum temperature for the month of 30.4C on the 21st & 22nd was the
highest on record for the month of October. The previous highest was 29.3C on
26th October 2014.
NORTHERN TABLELANDS HEAVY SNOWFALLS - 2nd August - Snow fell over a wide area of the Northern
Tablelands during the day. In Guyra the snow started
in the early hours and continued throughout the day, finally stopping at around
5.30pm. The snow was at its heaviest from around 10am to 12 noon. By late
afternoon snow covered the ground to a depth of about 30 cms.
The snow extended south to Walcha and the Moonbi Range, east along the Snowy Range to Ebor, and north
to Glen Innes and across the border to the Granite Belt where there were light
falls in the Stanthorpe area, and also west to Bundarra and the
Narrabri area. The New England Highway was closed north and south of Guyra due
to snow and fallen trees, and also the road east to
Ebor. Many areas also experienced loss of electricity for extended periods due
to fallen trees across power lines.
On 3rd August snow remained on the ground in Guyra
before melting later in the day.
The snowfalls were the result of upper level cold air
over northern New South Wales combined with moisture from the east along a surface
low pressure trough associated with an intense low pressure
system off the New South Wales North Coast.
This was estimated to be Guyra’s heaviest snowfalls
since the big snow event on 3rd-4th July 1984.
Temperatures stayed around or below freezing for most of the 2nd, with the
maximum from 5am to midnight of 0.8C at 6.45am.
PHOTOGRAPHS NEEDED OF THIS EVENT - I need several good
photos of snow in Guyra from this event to add to
these webpages with a credit to yourself of course. Please email images to me
here: enquiries@weatherarmidale.com
JULY SNOWFALL - 2nd July - Light
snowfalls occurred in the early hours of the morning, settling on the ground to
a depth of around 2 cms. The snow remained on the
ground until around 11am when it melted. Strong winds, cloud
and drizzle persisted throughout the day with the
temperature reaching a maximum of 6.1C, although the winds made it feel much
colder. The snowfalls were produced by low surface temperatures and showers
being driven inland by an intense low pressure system
off the New South Wales Hunter coast.
COLD OUTBREAK AND SNOW - 9th June - Very cold, windy and showery
conditions affected the Northern Tablelands with light snowfalls in the higher
areas including Black Mountain, Guyra and Ben Lomond.
In Guyra the heaviest snow occurred in the morning
around 10am with lighter intermittent falls during the rest of the day. Due to
the temperature not being quite low enough, and the wet ground, the snow mostly
did not settle. The snowy conditions were the result of very cold
south-westerly winds following a front and low pressure
trough combined with upper level cold air. After a
minimum temperature of 0.7C, the maximum for the day was only 4.9C, although
the strong westerly winds made it feel much colder. This temperature was the
lowest June maximum for four years.
ZERO FROSTS IN MAY CREATES NEW RECORD - Up to the end of May 2025 Guyra remained frost-free for the year. This created a new
record for the month of May with the previous lowest being one frost in May
1983 and also in 1991 (from 47 years of frost
records). In Guyra the frost season usually starts in
late April or early May. The lack of frosts was the result of an unusually high
number of low pressure troughs affecting northern New
South Wales during 2025 with cloudy conditions persisting during nights
preventing the usual overnight radiation cooling of temperatures to frost
levels.
These cloudy nights also resulted in the May overnight
minimum temperatures at their highest levels on record. The average minimum for
May 2025 was 6.9C. The long term average is 3.8C (from
92 years of records). The previous highest was 6.7C in May 1989.
Guyra Weather News Archive
Weather news from previous years here.
Yearly Statistics Tables

1982 1983 1984 1985 1986 1987
1988
1989
1990 1991 1992 1993 1994 1995 1996 1997 1998 1999
2000 2001 2002 2003 2004 2005 2006 2007 2008 2009
2010 2011 2012 2013 2014 2015 2016 2017 2018 2019
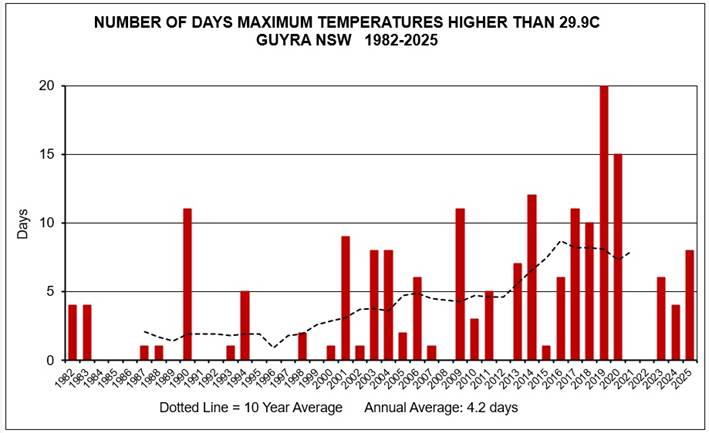
Graph: CLIMATE
CHANGE AT GUYRA - Average yearly
temperatures since 1982.
The dotted line is the 10 year average.
Snow Dates
Dates
on which it has snowed in Guyra since 1982, including
light non-settling falls.
Annual average 4.6 snow days.
1982: 5 days:
21/6, 22/6, 19/7,
20/7, 30/9
1983: 5 days: 27/6,
8/7, 1/8, 28/8,
6/10
1984: 8 days: 29/6,
30/6, 3/7, 4/7,
5/7, 11/8, 12/8,
19/9
1985: 9 days: 20/5,
21/5, 5/6, 6/6,
21/6, 19/7, 8/8,
2/9, 3/9
1986: 3 days: 23/6,
9/7, 6/8
1987: 3 days: 28/5,
23/7, 1/9
1988: 2 days: 8/8,
20/9
1989: 11 days: 10/6,
11/6, 21/6, 22/6,
24/6, 17/7, 18/7, 23/7, 24/7,
8/8, 26/9
1990: 8 days: 28/6,
2/7, 3/7, 3/8, 10/8,
23/8, 26/8, 22/10
1991: 6 days: 13/6,
10/7, 11/7, 14/7,
24/8, 12/9
1992: 10 days: 11/6,
24/6, 25/6, 26/6,
10/7, 20/7, 8/8,
13/8, 16/9, 29/9
1993: 1 day: 4/8
1994: 8 days: 13/4,
28/6, 30/7, 31/7,
21/8, 21/9, 27/9,
8/10
1995: 4 days: 17/6,
21/6, 19/7, 28/7
1996: 8 days: 12/7,
13/7, 14/7, 15/7,
21/7, 30/7, 19/8,
3/9
1997: 0 days
1998: 5 days: 23/6,
30/6, 29/7, 30/7,
31/7
1999: 3 days: 16/6,
14/8, 15/8
2000: 10 days: 28/5,
29/5, 30/5, 31/5,
1/6, 30/6, 27/7,
28/7, 24/8, 25/8
2001: 4 days: 7/7,
8/7, 26/8, 27/8
2002: 0 days
2003: 2 days: 24/7,
26/7
2004: 6 days: 20/6,
8/7, 17/7, 18/7,
5/8, 18/8
2005: 4 days: 22/6,
23/6, 10/7, 17/9
2006: 3 days: 4/8,
7/9, 16/11
2007: 9 days: 8/6,
9/6, 19/6, 20/6,
27/6, 28/6, 8/7,
9/7, 10/7
2008: 9 days: 17/5,
18/5, 9/7, 27/7, 28/7, 5/8, 6/8, 23/8, 22/10
2009: 2 days: 10/6,
15/7
2010: 5 days: 3/7,
2/8, 12/8, 26/8,
16/10
2011: 5 days: 19/7,
9/8, 18/8, 10/9,
1/10
2012: 4 days: 5/6,
28/7, 1/8, 12/10
2013: 1 day: 25/6
2014: 5 days: 3/5,
4/5, 30/6, 18/7,
3/9
2015: 6 days: 5/6,
12/7, 13/7, 16/7,
17/7, 6/8
2016: 4 days: 24/6,
27/6, 5/7, 6/7
2017: 0 days
2018: 2 days: 18/6,
7/7
2019: 4 days: 4/6,
10/8, 11/8, 9/9
2020: 4 days: 2/6,
22/6, 13/7, 9/8
2021: 9 days: 9/6,
10/6, 11/6, 20/7,
21/7, 24/8, 25/8,
14/9, 21/9
2022: 2 days: 13/7,
23/8
2023: 0 days
2024: 4 days: 18/5,
15/7, 16/7, 17/7
2025: 3 days: 9/6,
2/7, 2/8
Details of Guyra
Snowfalls since 2006
Gallery of Northern
Tablelands snow photographs
HISTORIC EVENT - The January 1939
Heatwave
During the middle of January 1939 a severe heatwave affected south-east
Australia with record high temperatures recorded in Sydney, Melbourne and
Adelaide as well as a number of towns in northern New South Wales.
The following maximum temperatures were recorded in Guyra:
January 10th: 33.9C, 11th: 34.4C, 12th: 33.9C,
13th: 35.0C, 14th: 35.6C, 15th:
37.8C, 16th: 35.6C, 17th: 33.3C.
The maximum of 37.8C on the 15th is the highest on record for Guyra.
On the same day nearby Armidale also recorded its
highest temperature on record of 39.7C.
Return to Armidale
Weather homepage